May
2022
Investing Basics: What is the FTSE 100?
DIY Investor
10 May 2022
We hear updated FTSE 100 and closing figures quoted every day on the news and in the papers, but what actually is it, and why does it matter?
FTSE 100 is an index comprising the most valuable, ‘blue chip’, companies listed on the London Stock and is seen as a barometer of the health of major companies listed in the UK and the wider UK economy.
Started on 3rd January 1984, FTSE 100 was jointly owned by the Financial Times and the LSE (hence FTSE – FT and SE) and ‘100’ by virtue of the number of companies in it; FTSE 100 is just one of thousands of global indices maintained by the FTSE Group.
Other FTSE UK indices include the FTSE 250 – the 250 largest companies after the FTSE 100 – and the FTSE Small Cap for companies smaller than those. The FTSE 100 and FTSE 250 are combined to make the FTSE 350 and by adding the FTSE Small Cap you get the FTSE All-Share.
The value of the FTSE 100 at launch was arbitrarily set at 1,000, which represented the combined value of the companies on that day – say, £100 billion. If a year later these companies were worth £200 billion the FTSE index would be 2000.
Its current level of around 7,300 means that the top 100 companies are, in total, worth 7.3 times the combined value of the top one hundred companies that comprised the index when it launched.
The make-up of the index changes dramatically with mergers, acquisitions, entrants and departures and it is therefore a useful indicator of market activity.
Adjusting the FTSE
The index is adjusted once a quarter to ensure it still reflects the top 100 companies although significant changes to companies affecting companies within the index will be reflected along the way.
The process for review is simply a matter of identifying the one hundred largest companies listed on the LSE by market capitalisation (no of shares x price per share) at that time; this is then ratified by committee in March, June, September and December.
There is a ‘transition zone’ whereby if a company is in the FTSE 250 and climbs into the top 90 companies, it can enter the FTSE 100; if a FTSE 100 company falls to 111th position or below in the rankings, it will fall into the FTSE 250.
This ensures that there are not too many changes at each review – investors in the index seek stability and might otherwise have to make excessive and expensive changes to their portfolio.
Sometimes no changes to the FTSE 100 are made at review, but during periods of volatility such as the dot com boom, large numbers of companies were entering and leaving the index every quarter.
Watching the FTSE
The value of the FTSE 100 is calculated every fifteen seconds on trading days between 08.00 hrs when it opens until 16.30 hrs when it closes; the figure quoted on the evening news is its closing value on that particular day and when it is ‘up’ or ‘down’ the change is being quoted against the previous day’s close.
The level of the FTSE 100 affects most people in the UK even if they don’t directly invest; pension funds invested in UK equities are directly affected and the level of the index directly affects the return they will achieve.
The FTSE 100 also reflects general economic and international events and it will often tumble in response to markets falling around the world.
Its largest one-day percentage fall was 12.22 % on 20 October 1987, the day after ‘Black Monday’.
On the 12th of March 2020, amid the escalating crisis surrounding the coronavirus and fears of a global recession, the FTSE 100 suffered the second largest one day crash in its history and the biggest since the 1987 market crash. On the 23rd of March, the FTSE index was at 4,993.89 but has since recovered.
Thirty years of the FTSE 100
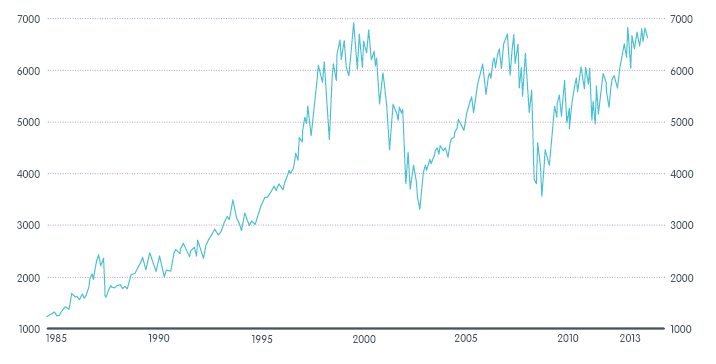
In April 2015 the FTSE 100 hit a high of 7103.98, eclipsing its previous peak in the late 1990s which had been fuelled by the boom in technology companies.
The index’s highest closing value of 7,877.45 was reached on 22 May 2018; the highest intra-day value of 7,903.50 was reached on 22 May 2018.
If you’d reinvested your dividends between the FTSE 100’s dotcom-era high and its 2018 high, you’d have roughly doubled your money, even with the index itself barely rising in terms of capital value
Its lowest ebb to date has been its closing low on 12th July 1984 when it fell to 978.7; the only day the index was not calculated was 16 October 1987, the day after the ‘Great Storm’ wreaked havoc across London and the South East.
Equities » Equities Commentary » Equities Latest » Financial Education » Take control of your finances commentary
Leave a Reply
You must be logged in to post a comment.