Dec
2023
The best performing investment trust of 2023 (so far)
DIY Investor
23 December 2023
3i’s price rise this year is unlikely to be repeated, but what about the rest of the LPE sector?…by William Heathcoat Amory
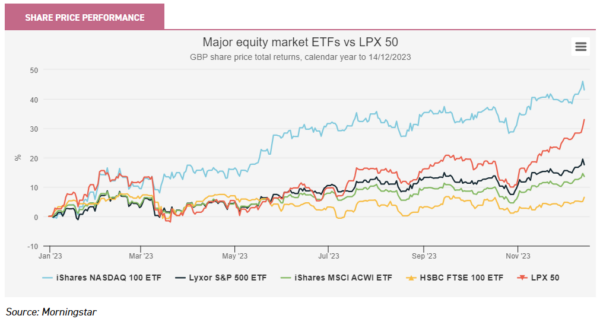
As a year, 2023 has been yet another that many in the investment world might perhaps prefer to forget. Investors may be forgiven for scratching their heads reflecting on the headline performance of equity markets, which on the surface have shown remarkable resilience given such a poor start to the year. After all, it is only nine months ago since Silicon Valley Bank collapsed in March 2023, the US’s second-largest bank collapse in history. Since then, AI fervour has led to a similar set of the same stocks that led markets in the years leading prior to 2022 (the newly coined ‘magnificent seven’) recapturing all of 2022’s lost ground, and more, in 2023. Lightning continues to strike the same ground—but how long can this continue? According to Morningstar, these seven companies now constitute 29% of the S&P 500’s aggregate market capitalisation, a situation that hasn’t existed since at least 1980. As we show in the graph below, by comparison to the Nasdaq, other major equity markets have had a rather pedestrian year, although one that has much improved since the end of October.

Within the investment trust sector, according to the AIC, the average investment company has generated a share price total return of 3.4% in the calendar year to 30 November. Given what we show above, it is perhaps no surprise that sub-sectors such as Technology & Technology Innovation (weighted average share price total return of 37.5%) and North America (13.6%) have been strong performers. However, what is perhaps surprising is the strong showing from the private equity sector, which according to the AIC data has delivered a 43.4% return, the best performing of the sub-sectors over the 11 months to 30/11/23.
TEN BEST-PERFORMING SECTORS IN THE YEAR-TO-DATE
| SHARE PRICE TOTAL RETURN % | |||||
| AIC Sector | YTD* | 1 year | 3 years | 5 years | 10 years |
| Average investment company | 3.36 | 2.43 | 16.04 | 88.81 | 153.61 |
| Private Equity | 43.39 | 44.38 | 89.52 | 145.21 | 153.61 |
| Technology & Technology Innovation | 37.48 | 28.34 | 9.05 | N/A | N/A |
| North America | 13.62 | 10.28 | 21.11 | 134.45 | 202.40 |
| Europe | 12.27 | 10.39 | 16.61 | 50.07 | 134.33 |
| India/Indian Subcontinent | 10.40 | 7.88 | 44.25 | 38.67 | 184.94 |
| Property – UK Logistics | 8.21 | 5.25 | 0.46 | 37.30 | N/A |
| Debt – Structured Finance | 7.76 | 8.29 | 24.24 | 18.38 | N/A |
| Debt – Loans & Bonds | 7.67 | 8.82 | 14.42 | 11.67 | 19.91 |
| UK All Companies | 4.94 | 3.22 | 2.89 | 23.11 | 70.95 |
| Leasing | 3.63 | 6.86 | 110.26 | -11.13 | 57.96 |
Source: AIC/Morningstar. * Year-to-date = 11 months to 30 November 2023
This is quite a surprising outperformance. Digging into the data, it is clear that 3i, as the largest constituent in the sector, has been a standout performer delivering share price returns of an impressive 71% to the end of November. The NAV on the other hand has been more pedestrian—although still impressive at 18.6%. The share price has therefore done most of the work, with a discount to NAV of c. 20% at the start of the year swinging to a premium of c. 25% over the period. On a market capitalisation-weighted basis, 3i makes up two-thirds of the entire UK-listed sector. Other than size, it is also not very representative of a ‘fund’, given that 70% of the portfolio is represented by one company—Action, the European discount store chain that has been an extremely strong performer over many years and has been an increasing driver of NAV total returns since it first invested in 2011.
In fact, Action has been one of the best private equity buyout deals in Europe. According to The Times, by early 2023, Action had returned an incredible 88x 3i’s initial €279m equity investment. Action has been such a successful deal, that continues to deliver capital growth to investors, that it is represented in at least four other of the London listed private equity trust (LPE) peer group portfolios. Action is the biggest single investment for NB Private Equity Partners (NBPE) (6% of the portfolio), abrdn Private Equity Opportunities (APEO) (5.6%), Pantheon International (PIN) (1.2%), and the fourth largest holding for HarbourVest Global Private Equity (HVPE) (0.7%). Action serves to illustrate the spectacular returns achievable from private equity investing, but also acts as a reminder that the niche exposures that private equity portfolios offer mean NAV trajectories do not necessarily have to reflect that of broader equity markets.
As this illustrates, other private equity trusts are very far from having all their eggs in one basket, making them in our view much more suitable for investors on a risk-adjusted basis. We show below the main constituents of the London LPE universe, with their share price and NAV returns to date (as of 13/12/2023), as well as their respective discounts. We note that Princess Private Equity Holdings’ (PEY) discount had widened significantly in November 2022 when the pressure of keeping its currency hedges in place left it unable to pay its dividend. The discount has staged something of a recovery with the reinstatement of the dividend and a new chairman this year. Elsewhere, PIN announced a significant and very accretive tender and buyback programme during the year, which has gone some way towards narrowing the discount, boosting the share price performance.
PRIVATE EQUITY SECTOR YEAR-TO-DATE PERFORMANCE (TOTAL RETURN) AND DISCOUNT
| SHARE PIRCE % | NAV % (GBP) | PREMIUM / (DISCOUNT) % | |
| 3i Group | 71.0 | 18.5 | 27.9 |
| HgCapital Trust | 17.0 | 9.6 | -18.9 |
| abrdn Private Equity Opportunites | -0.5 | 5.3 | -42.2 |
| Pantheon International | 13.1 | 4.7 | -39.5 |
| ICG Enterprise Trust | 6.0 | 4.0 | -39.1 |
| Oakley Capital Investments | 8.0 | 3.0 | -30.1 |
| Princess Private Equity Holdings | 30.6 | 1.9 | -30.5 |
| HarbourVest Global Private Equity | 1.6 | 1.6 | -43.4 |
| CT Private Equity Trust | 16.9 | 1.5 | -33.5 |
| Apax Global Alpha | -15.6 | -1.4 | -30.3 |
| NB Private Equity Partners | 8.8 | -2.0 | -26.5 |
Source: Morningstar, as at 13/12/2023
As the table above suggests, taking the weighted average of the London LPE sector as a proxy for private equity returns year-to-date is therefore misleading. In fact, in aggregate NAV returns have been relatively muted for the private equity industry in general, as suggested by the experience of the London LPE sector. We highlight that those trusts with a significant dollar exposure have experienced something of a headwind, with dollar weakness of c. 4.8% relative to GBP hindering NAV returns. NBPE, PIN, and HVPE would be three trusts we would highlight which have been affected by this. By comparison, the euro has only weakened by c. 1.3% which has been less of a hindrance to trusts exposed here. In our view, the factors behind this muted performance are the general slowdown in private equity deal activity, a result of previously fevered deal activity leading up to the end of 2021 and higher interest rates. Anecdotally, underlying earnings growth for portfolio companies as reported by the trusts above has generally remained resilient.
In NAV terms, performance has been broadly in line with that of the wider private equity industry in general. LPX are a specialist index provider, that monitors and analyses the global LPE sector, which includes the likes of American behemoths KKR, Apollo, and Blackstone. The LPX Listed Private Equity Index (LPX) series was launched in 2004 and serves as specialist performance benchmarks for the global private equity asset class, available as a NAV and share price series. The LPX Composite (the flagship index) has so far delivered a NAV total return in GBP of 4% YTD, which is comparable to the trusts above.
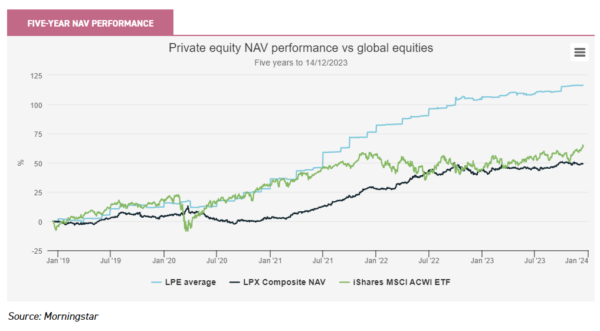
Zooming out, and looking back, how representative of the wider global peer group are the London LPE trusts? Happily, we illustrate below that the simple average of the London LPE peer group has performed extremely well when compared with the LPX index over five years, although there is an element of survivorship bias: our selection of trusts excludes those which are in the process of winding-up. Additionally, the LPX index includes venture capital companies, the performance of which have detracted since 2022.

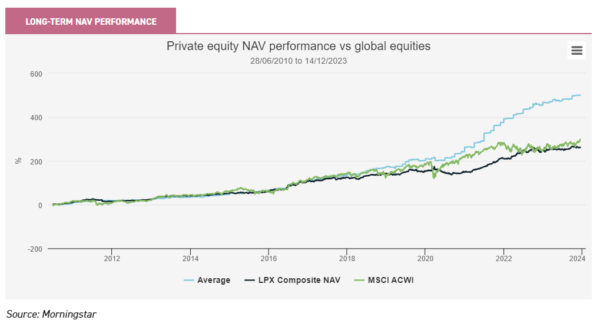
Over the longer term too, as we show in the graph below incorporating data for as far back as Morningstar allows, on a NAV basis these LPE trusts have on aggregate outperformed the same indices very strongly, although we note that the bulk of the outperformance over this 13-year period has been achieved more recently. Given discounts have widened out, the share price outperformance has been significantly lower.

The graph above ties in with the AIC’s original table, showing the top ten performing sectors of London listed trusts. Over ten years, AIC’s private equity sector has beaten the others by a very long way on a share price basis, and has been consistently strong over every time period. Discounts were very wide ten years ago, but in our view, the outperformance in share price terms highlights the historic persistence of NAV returns that the best managers within the private equity industry are capable of delivering. Certainly, there will always be fallow periods, such as those that we have seen this year. And we believe that there is also evidence that dispersion between the best and the worst managers in the private equity industry is significantly wider than within quoted equity funds. Both of these facts, in our view, are reflective of private equity being the ultimate arena for truly active managers. In identifying and buying majority ownership of a business, setting the strategic direction, and deciding when or who to sell to at the end, there is no getting away from the fact that good decision-making and skill are critical components of successful private equity investing. As we highlight in the table further below, the London listed fund of fund peer group have successfully harnessed the better performers. As UK investors, we are also lucky to have several directly investing trusts listed in London alongside 3i, which have also delivered strong returns. HgCapital (HGT) and Oakley Capital Investments (OCI) offer sector-specific exposure and have both been strong performers by exploiting the expertise developed within their niches.
At the same time, the dispersion of returns between private equity managers in general may mean that having a more diversified exposure may make sense, especially for those with a more moderate appetite for risk-taking. We highlight in the table below the broad distinctions that can be made between the London LPE trusts. Within the fund of fund hybrids, ICG Enterprise and APEO have a focus on the US and European managers, but CT Private Equity (CTPE) differentiates itself by investing through smaller private equity management groups, arguably hungrier to deliver returns and targeting the lower mid-market in terms of deal size. Pantheon International (PIN) has been increasingly investing in co-investments, making it an interesting hybrid, offering a diversified global access route to what the managers see as the best private equity opportunities available. We hope to publish a detailed profile on the trust soon—please click here to be alerted when it is. NBPE offers a unique approach within the London LPE sector, focussing on co-investments. These are equity investments made alongside third-party private equity sponsors, enabling investors to have the benefits of a direct investing manager, but with many of the diversification benefits that a fund of funds has. Making investments directly means NBPE’s investors only pay one layer of management and incentive fees.
LONDON LISTED PRIVATE EQUITY TRUSTS (NOT IN WIND-UP)
| DIRECT | CO-INVESTMENTS | CONCENTRATED FUND OF FUNDS/HYBRID | DIVERSIFIED FUND OF FUNDS |
| 3i | NB Private Equity Partners | abrdn Private Equity Opportunities | HarbourVest Global Private Equity |
| Apax Global Alpha | CT Private Equity | ||
| HgCapital | ICG Enterprise | ||
| Oakley Capital Investments | Pantheon International | ||
| Princess Private Equity |
Source: Kepler Partners
In terms of outlook, it is possible that with the US Federal Reserve signalling that interest rates will start to be cut in 2024, private equity deal activity hots up once again. The relatively wide discounts that currently afflict the sector may narrow. That said, we do not necessarily advocate the private equity sector as a discount play, nor for anyone other than long-term investors. Over the short term, activity may not pick up, and discounts may remain wide (or even widen). Over the long run we believe that private equity managers create value in a repeatable process over cycles, which will drive NAV returns. In our view, the reasons behind this can be ascribed to these characteristics, which remain persistent, are many, but we believe the key drivers include:
- Long-term thinking – illiquid investments such as the equity in private companies mean managers need to take a longer-term view when making investment decisions. Fund structures reflect this, which often require investors to lock capital up for periods of ten years or more. As a result, private equity managers can afford to be more focussed on fundamental long-term value creation than achieving short-term profit targets.
- Stock picking – there is no easily accessed market or exchange for private investments, so private equity managers not only need to be in a position to identify good companies that are available to buy but also have the resources and capabilities to do the upfront research and due diligence.
- Alpha – private equity managers are often sector-focussed and have detailed knowledge of the competitive landscapes within sectors or niches. Aside from buying businesses, their job is to create value by growing the business, expanding into new markets or business lines, or identifying potential bolt-on acquisitions. They typically have significant financial and capital markets expertise, which wouldn’t normally be found in such businesses.
- Alignment – incentivisation structures for private equity-backed businesses are based almost entirely on equity and base costs are kept as low as possible. This is the case for both the private equity backers as much as for the management teams of the businesses they invest in. Both are highly motivated to generate cash returns (rather than mark-to-market valuation gains) over the life of the investment—both in terms of success-based remuneration and in terms of their future careers.
At the time of writing, with signs that some animal spirits returning to markets (which could clearly turn out to be a simple ‘Santa-rally’), there is a chance that the rerating that 3i experienced this year, could broaden out to other constituents of the LPE sector. In the medium to long term investors should focus on the prospect of NAV total returns as the characteristics we highlight above continue to play out. As such, we believe private equity trusts remain an interesting and differentiated area for prospective long-term capital growth.
Disclaimer
This is not substantive investment research or a research recommendation, as it does not constitute substantive research or analysis. This material should be considered as general market commentary.

Leave a Reply
You must be logged in to post a comment.